[ad_1]
The growth behavior of Fusarium oxysporum
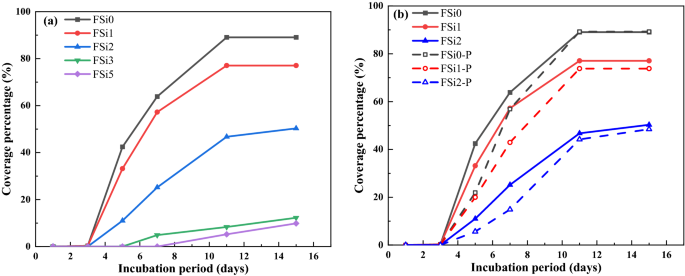
The growth behaviors of F. oxysporum feeding on multiple substrates at different concentration levels of Si source were evaluated. Images were taken of each sample after different incubation periods to record the development of mycelium. The influence of adding both PP fabrics and Si source to the feeding substrate on fungal mycelium growth was also considered in the study. Photos of the growth patterns are summarized in Table 2 and the corresponding surface area coverage is plotted in Fig. 3. The surface area of fungal mycelium was analyzed via images by the open-source software Image J (https://imagej.nih.gov/ij/). The first section of the table includes all fungal mycelium grown with substrate containing different concentrations of Si source, i.e., FSi0, FSi1, FSi2, FSi3, and FSi5. Fungal inoculum germinated within the first 3 days in FSi0, FSi1, and FSi2. As the Si source was increased, it took longer for fungal inoculum to germinate, e.g., 4–5 days in FSi3, and 6–7 days in FSi5. Using the surface area of the Petri dish as a baseline, the percentage of surface area of the petri dish covered by fungal mycelium in each sample are 89.07%, 77.07%, 50.31%, 12.26%, and 9.85% after 15 days, respectively. This indicates that the absorption of Si source delayed the surface area development of fungal mycelium. The delay is a result of the addition of Si source that promotes the activities of lysosome, releasing more lytic enzymes. If the concentration of Si source is too high, the number of lytic enzymes that is produced will dissolve a large proportion of the fungal cell wall. In such a case, the normal activities of fungal cells, such as fungal growth, are inhibited19. The inhibiting effect was more obvious in the fungal fibers grown with higher concentration of Si source. The growth rates of fungal mycelium in FSi3 and FSi5 were so slow that they were not considered in the following laboratory-scale fire resistance tests.
After 15 days, the surface area of F. oxysporum feeding on the Si-free substrate on PP fabrics (89.27% of Petri dish) was similar to that of F. oxysporum grown without PP fabrics. However, the surface area of fungi grown with 1% and 2% Si source on PP fabrics covered 73.83% and 48.46% of their respective Petri dishes, both of which are smaller than that of fungi grown without PP fabrics (covered 77.07% and 50.31% of Petri dishes, respectively). Therefore, it can be concluded that the addition of PP fabrics delayed the fungal mycelium development when feeding on substrate with 1% and 2% Si source; the influence of PP fabrics on fungal growth feeding on Si-free substrate is insignificant. PP fabrics was found to slightly delay the fungal growth, possibly because when the PP fabrics were placed in the feeding substrate, they physically may have influenced the distribution of the feeding substrate as well as the fungal absorption of nutrient.
Micro-scale characterization
Microstructure of fungal fibers grown with Si source
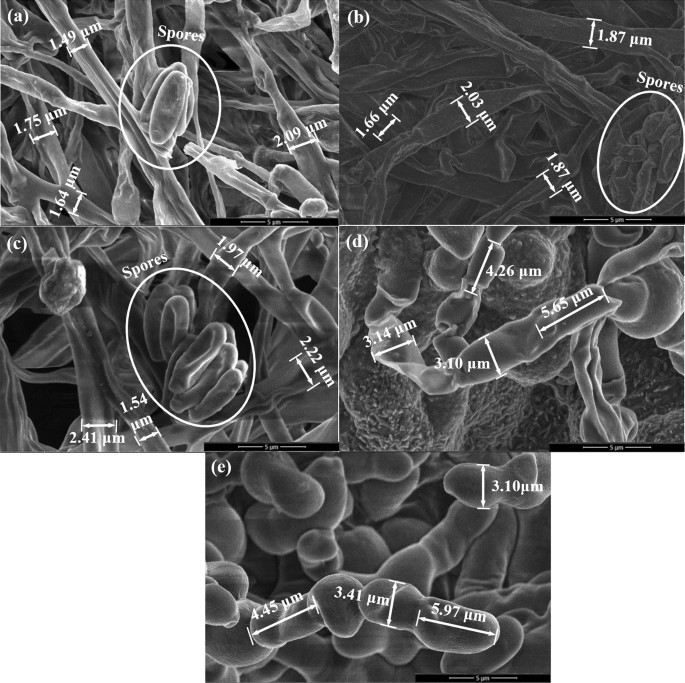
Scanning Electron Microscope (SEM) analysis was used for examining the morphological structures of fungal fibers grown with Si source. The addition of Si source generated a significant impact on the microstructures of the fungal fibers. The surfaces of fungal fibers grown with 0%, 1%, and 2% Si source (Fig. 4a–c) were straight and continuous. Several spores were found on the fungal fibers’ surface. The diameters of fungal fibers grown with 0%, 1%, and 2% Si source (Fig. 4a–c) were similar and ranged from 1.49 to 2.41 μm. However, fungal fibers grown with 3% and 5% Si source (Fig. 4d,e) were not straight and had a segmented structure. The lengths of distinct sections were around 4.26 μm to 5.97 μm. The diameters of fungal fibers grown with 3% and 5% Si source (Fig. 4d,e) were also much larger, ranging from 3.10 to 3.41 μm. The spores were not widely detected throughout the surface of the fungal fibers, which causes the lower growth rate in the sample with 3% and 5% Si source. These observations are directly associated with fungal metabolism. Once ingested into fungal cells, Si ions are essential for fungal metabolism21. Si source promotes the activity of lysosomes that discharge lytic enzymes22. Lytic enzymes make the cell wall plastic and easily elongated22. However, if Si source concentration levels are too high, fungal lysosome would release too many lytic enzymes, which dissolve a large proportion of the fungal cell wall. The plastic fungal cell walls might explain why the structure of fungal fibers become not straight and segmented when grown with 3% and 5% Si source. In addition, dissolving large part of fungal cell wall inhibits fungal growth, reducing visible spores in SEM images.
The EDS analysis was conducted on each sample spot indicated in Fig. 4. The weight ratios of corresponding main elements were summarized in Table 3. The fungal fibers grown with Si-free substrate (Sample a, FSi0) had a Si content of 0.12%. Slight increases of Si elements were found in fungal fibers grown with 1% and 2% Si source (i.e., with Si contents of 0.35% and 0.58% respectively). However, relatively higher Si contents (2.55% and 6.60%) were found in samples d and e (FSi3 and FSi5). Based on the mechanism of fungal growth with Si source, Si source would be absorbed in the fungal cell and incorporated as part of the fungal structures. Normal fungal activities and growth are inhibited due to the high concentration of Si source. This high concentration of Si source is the absorption threshold for fungi19. When fungi feeds on substrate containing Si source above the absorption threshold, the fungal cell wall dissolves and the structure of the fungal fibers becomes unsmooth19. Both SEM and EDS analyses indicate that 3% Si source is likely the absorption threshold of F. oxysporum. Under the threshold, most Si source were absorbed into fungal cells and only small amount of Si element (0.12 ~ 0.58%) were detected outside the fungi cells in FSi0, FSi1, and FSi2. Above the absorption threshold, higher concentration of Si source remained outside of the fungal cells, as seen in FSi3 and FSi5. High concentration of Si source leads to the changes in the fungal structure as well as to the reduction of fungal fiber production rates.
FTIR analysis
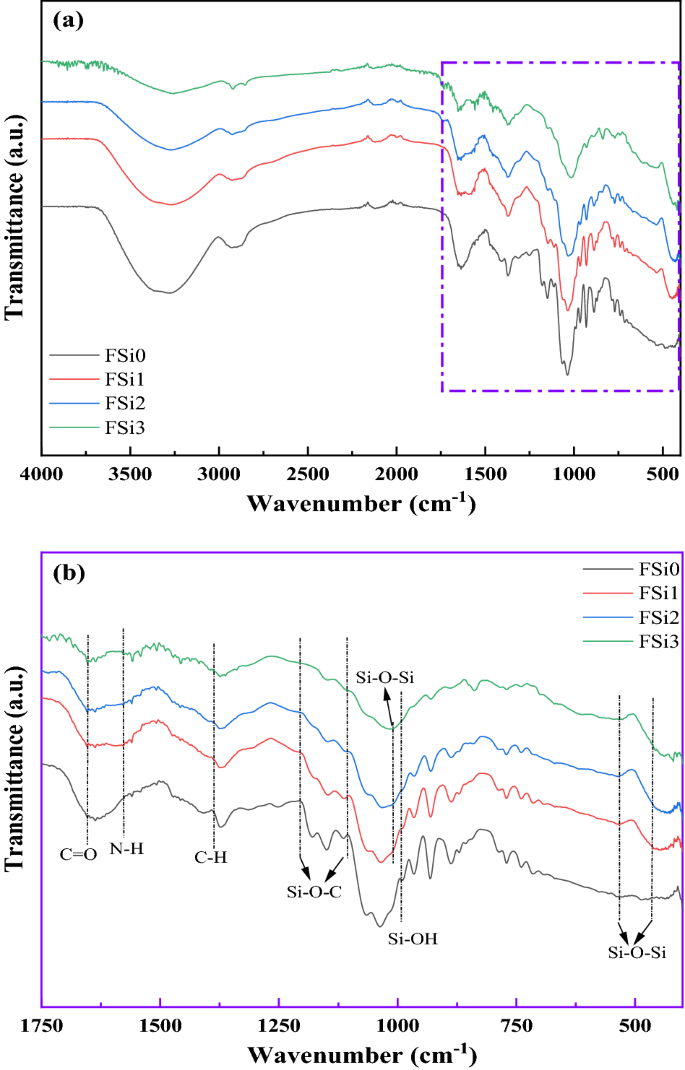
FTIR analysis was conducted to investigate the changes in chemical bonds due to the Si source and the interactions between fungi and PP fabrics. Figure 5 shows the transmission spectra of fungal fibers grown with different concentrations of Si source. Peaks in the spectral range at around 460 cm-1 and 540 cm-1 correspond to the bending and rocking of Si–O bonds respectively23. The broad band between 1000 and 1100 cm-1 was assigned to the stretching mode of Si–O and to the chemical constituents of fungal fibers, parts of which overlap24. The high bond energy of Si–O led to lower thermal conductivity and stronger fire resistance, delaying the degradation of fungal fibers19. The peak at around 960 cm−1, observed in samples containing Si source, was attributed to the silanol groups (Si–OH bond)25. The peak at 1386 cm-1 was attributed to C-H bending modes in FSi1, FSi2, and FSi326. Meanwhile, an additional peak of N–H was detected at 1580 cm-1 and a free C = O bond was observed at around 1701 cm-1 in the FSi1, FSi2, and FSi327,28. Their existence indicates that the structure of the fungal fibers changed due to the absorption of Si source. The bands at 1220 cm-1 and 1105 cm-1 were assigned to the Si–O–C in FSi1, FSi2, and FSi329,30, which demonstrates that the Si source was digested by the fungal fibers and became part of their structure.
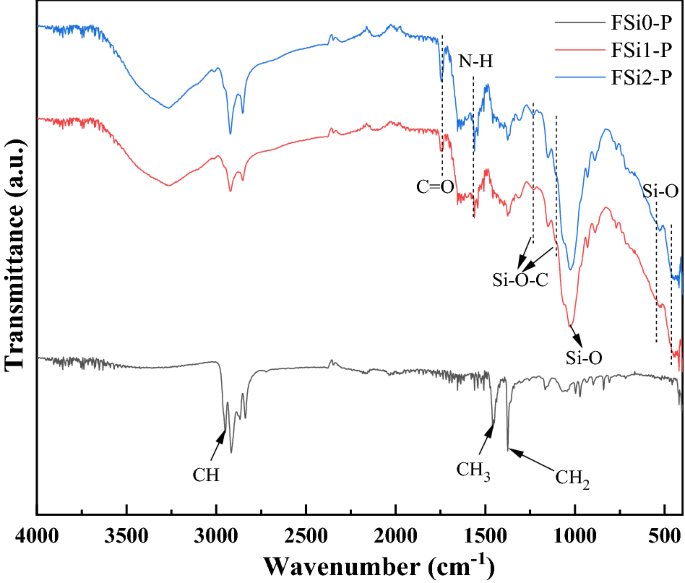
The FTIR analysis (Fig. 6) illustrates the representative infrared spectra of fungi-PP fabrics grown with different concentrations of Si source. The FTIR spectrum of FSi0-P was similar to that of PP fiber, from which the bands assigned to the CH, CH2, and CH3 were observed at 2950 cm-1, 1375 cm-1, and 1453 cm-131. This indicates that the interaction between fungi and PP fabrics was physical, and that the fungal growth did not modify the chemical compounds of the PP fabrics. The absorption of Si source had a significant impact on the chemical functional groups of fungal fibers. The FTIR analysis on fungi-PP fabrics and fungi without PP fabrics, both grown with the same levels of Si source, yielded similar results. The bending and rocking of Si–O bonds generated bands from 460 to 540 cm-1. The band between 1000 and 1100 cm-1 was attributed to Si–O stretching vibrations24. Similar to the FSi group, C = O bond and N–H bond were found in the fungal fibers grown with Si source on PP fabric. The peaks at 1220 cm-1 and 1105 cm-1, observed in FSi1-P and FSi2-P, corresponded to the Si–O–C group29,30. Presence of these additional bands indicates that the absorption of Si source contributed to the formation of fungal cells in the fungi-PP fabrics samples.
Thermal stability analysis of fungi grown with different concentrations of Si source
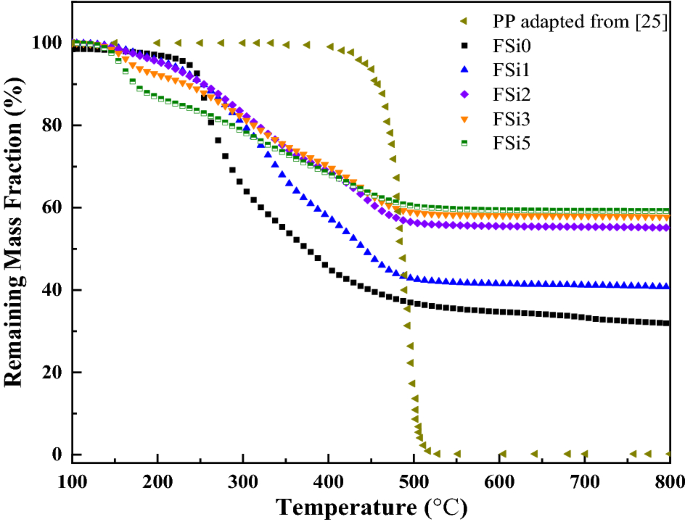
Figure 7 shows the results of thermogravimetric experiments on F. oxysporum grown with different contents of Si source. It shows thermal degradation under a heating temperature range of 100–800 °C. The remaining weight curve of PP fibers was used as the baseline for the comparison with that of fungal fibers grown with different levels of Si source. The thermal parameters (Tonset, the decomposition onset temperature; Kmax, the maximum mass loss rate; Tp, the temperature at the maximum mass loss rate; Kave, the average thermal degradation rate; Tu, the temperature at which residual weight is relatively stable; and the residual weight) were obtained from TGA and listed in Table 4.
TGA of six fibers at a heating rate of 10 °C/min. TGA results and residual mass of PP fibers are adapted from 32.
The TGA reveals that the decomposition onset temperature of sample FSi0 is 250 °C. The thermal degradation profiles of FSi1 and FSi2 show a similar trend with a higher decomposition onset temperature of 310 °C. However, the mass loss curves indicate an early decomposition, starting at 190 °C and 160 °C in FSi3 and FSi5, respectively. This is attributed to the absorption of relatively higher content of Si source (3% and 5% volume fractions) leading to a more soluble cell wall and an early loss of bonded water content from the cells19. With the increasing Si source in substrates, the fungal fibers became more thermally stable, as indicated by a smaller slope in the decomposition curves (i.e., smaller Kave, the average thermal degradation rate). The highest average thermal degradation rate of fungal fibers grown with different concentrations of Si source was found in FSi0 (0.033%/s), which is about one tenth of that of PP fibers (0.270%/s). The absorption of Si source also contributed to an improvement of residual weight in fungal fibers. More residuals were retained in the fungal fibers grown with higher contents of Si source, and the residual weights of FSi0, FSi1, FSi2, FSi3, and FSi5 were 31.94%, 40.77%, 55.15%, 57.77%, and 59.20%, respectively. The char yield was more sensitive to the Si source at small concentrations (i.e., below 2%). When the Si source concentration was higher than 2%, the residual weight was around 55–59% and only a minor increase occurred with the Si source concentrations.
The TGA results of PP fibers were adapted from32 and used to compare of fungal fibers grown with various concentrations of Si source. The decomposition temperature in fungal fibers grown with Si source ranged from 160 to 310 °C, which is much lower than that of PP fibers. This would contribute to earlier melting of fibers that creates voids in concrete, releases temperature-related vapor stress, and potentially improves the fire safety of concrete structures. Meanwhile, the maximum mass loss rate and average degradation rates of fungal fibers grown with Si source are much smaller than that of PP fibers. The smaller thermal degradation rate of fungal fibers improves the thermal stability over PP fiber when exposed to high temperatures. Additionally, fungi fibers achieved high residual weights (31.94–59.20%), which are significantly larger than that of PP fibers (only 0.2%) after exposure to a temperature of 800 °C.
Flammability analysis by MCC
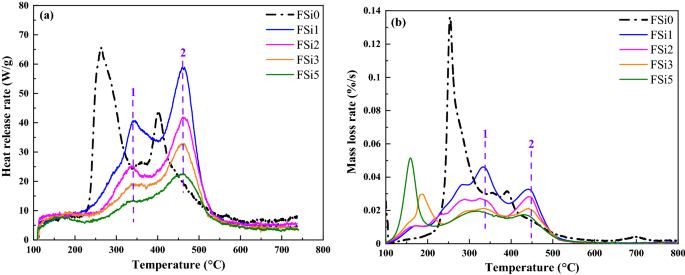
MCC is a standard method for fire-resistant assessment. It measures the heat release by the combustion of the vapor released from the material at an increasing temperature. The MCC results from fungal fibers grown with Si source were compared with fungal fibers grown with Si-free substrate. The heat release rates at different temperatures for each sample are shown in Fig. 8a. The mass loss rate curves from TGA are summarized in Fig. 8b. Compared with the fungi fibers grown with Si-free substrate (FSi0), the addition of Si source in the substrate retarded the release of combustible vapor in mycelium fibers. The most prominent peaks of heat release rate in FSi0 were at 250 °C and 400 °C. In comparison, these peaks increased to higher temperatures (i.e., 340 °C and 460 °C) in the fungal fibers grown with Si source (i.e., FSi1, FSi2, FSi3, and FSi5). The release heat rate decreased in the fungal fibers grown with higher concentrations of Si source since the peak temperature was lower in the samples grown with higher concentration of Si source.
The observed peaks at 250 °C and 400 °C in the mass loss rate curve from TGA of FSi0 are consistent with the peaks shown by MCC measured heat release rate curves. This indicates that the mass loss in TGA at these peaks are associated with the release of combustible vapor at 250 °C and 400 °C. For fungal fibers grown with Si source, the release of combustible mass leads to peaks at 340 °C and 450–460 °C, which is much higher than that of fungi fibers grown without Si source. Moreover, with the increase of Si source, the mass loss rate decreased in the range from 250 to 500 °C, which is consistent with the trend seen in the MCC measured heat release rate curves. However, additional peaks were observed from 150 to 250 °C in the TGA mass loss rate curves of FSi3 and FSi5, while no peaks presented at the same locations in the MCC heat release rate curves. This implies that the vapor in the range of 150 °C and 250 °C was non-combustible. A possible explanation is that when grown with higher concentration of Si source, the cell walls of fungal fibers become more flexible, which leads to the release of more non-combustible vapor at lower temperatures (150–250 °C) and subsequently the less release of combustible vapor at higher temperatures (250–500 °C).
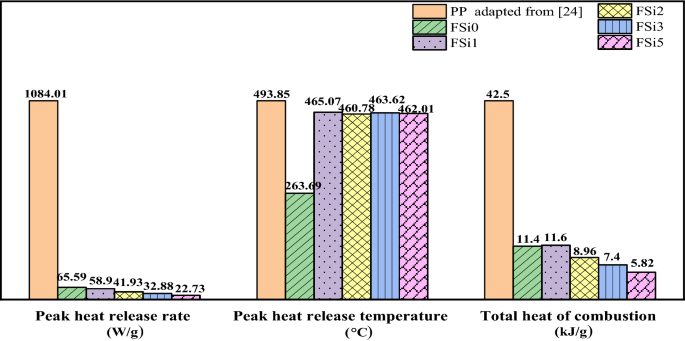
The peak heat release rates and the total heat of combustion are summarized in Fig. 9. The peak heat release rates of fungal fibers were 65.59 W/g, 58.90 W/g, 41.93 W/g, 32.88 W/g, and 22.73 W/g in FSi0, FSi1, FSi2, FSi3, and FSi5, respectively. The peak heat release rate was reduced up to 66% by the addition of 5% Si source in the feeding substrate. The heat release rate of PP fibers was 1084.01 W/g, which is 47 times higher than that of FSi5. The peak heat release temperature of FSi0 was 263.69 °C. The temperatures corresponding to the peak heat release rate of fungal fibers were 465.07 °C, 460.78 °C, 463.62 °C, and 462.01 °C in FSi1, FSi2, FSi3 and FSi5, respectively. The heat release peak temperature of PP fibers was 493.85 °C32. The total heat of combustion of FSi0, FSi1, FSi2, FSi3 and FSi5 were 11.4 kJ/g, 11.6 kJ/g, 8.96 kJ/g, 7.40 kJ/g and 5.82 kJ/g, respectively. This indicates that Si source in the feeding substrate contributed to the reduction of the total heat of combustion. The total heat of combustion of PP fiber was 42.50 kJ/g32, which is seven times higher than that of FSi5.
Overall, the results of MCC indicate that grown with Si source increased the threshold temperature for the release of combustible vapor in the fungal fibers; it also reduced the amount of combustible vapor released and combustion heat in the fungal fibers. Both of these factors improve the fire resistance of Si-sourced fungi fibers. Fungal fibers grown with Si source have significantly lower peak heat release temperature as well as lower total heat of combustion, which contributes to the improved fire safety. Compared with the commonly used PP fibers, these features of fungi fibers will help improve fire resistance when used in fiber reinforced concrete.
Lab-scale characterization
Heating ignition test
The heating ignition test was used to evaluate the fire resistance of the materials at laboratory-scale. Fire resistance was characterized by time to ignition, temperature when ignition, height of flame, and occurrence rates of ignition. Ignition time was defined as the moment at which a flame appears on the surface of samples. Ignition temperature was measured at the time at which ignition occurs. Flame height was characterized as the maximum height the flame reached. Ignition Occurrence Rate equals the number of samples that were ignited before they were completely degraded divided by the total number of samples. However, in some samples, ignition was never achieved. The ignition time, ignition temperature, and Ignition Occurrence Rate characterized the fire resistance of the fungal fibers while the flame height indicated the flaming intensity once ignited. Fungal fibers grown with 0%, 1%, and 2% Si source were tested and compared with PP fabrics. Fungi fibers grown with 3% and 5% exhibited growth rates so slow that they were not considered in the following laboratory-scale fire resistance tests.
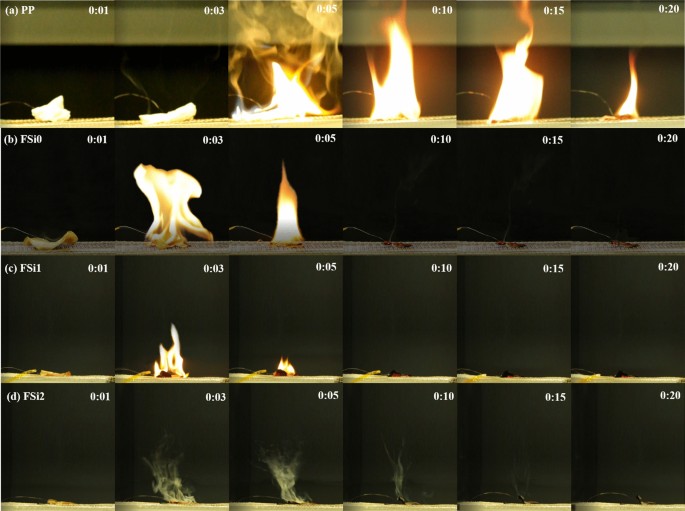
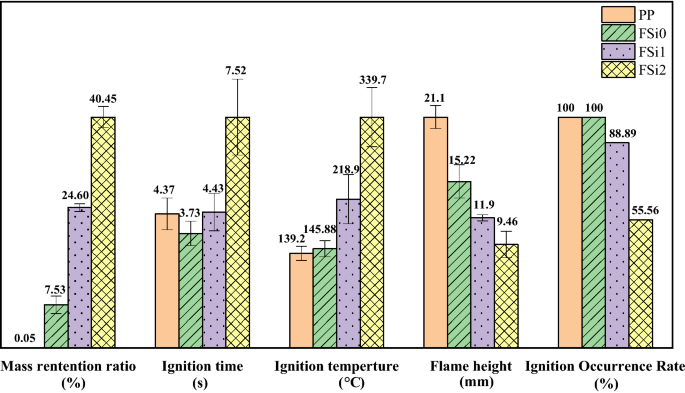
As revealed by the heating ignition test (Fig. 10), samples became crimped once they were heated. Ignition occurred in the first 3–5 s in the PP sample, FSi0 sample, and FSi1 sample. However, ignition and flame were never reached in FSi2, whose whole sample was degraded by heating. A wide and high flame with thick smoke was found in the PP sample. The addition of Si source in the feeding substrate decreased the intensity of fire in the fungal samples. The only thing observable in FSi2 is smoke.
As shown in Fig. 11, the cultivation with Si source increased the mass retained in the fungi sample. The mass retention ratio increased by 17.07% and 32.92% when comparing fungal fibers grown without Si source to those grown with 1% and 2% Si source. Meanwhile, PP fabrics burnt almost completely and only 0.05% were retained after the test. Most compositions in PP fabrics are combustible, which explains the long ignition persistence in PP fabrics (shown in Fig. 10a). Time to ignition of PP fabrics was measured as 4.37 s, and ignition time in FSi2 was 7.52 s. Ignition temperature, flame height, and Ignition Occurrence Rate are key factors in a fire accident. The flame height of fungal fibers (FSi0) was 5.88 mm lower and the ignition temperature was 6.88 °C higher than PP fibers. The fungal fibers cultivated with 1% and 2% Si source also caused a significant increase in the ignition temperature (by 73.02 °C and 193.82 °C) and a decline in flame heights (by 3.32 mm and 5.76 mm). One out of nine fungal samples grown with 1% Si source and four of nine fungal samples grown with 2% Si could not be ignited or degraded without flaming. These qualities indicate that fungal fibers achieved higher fire resistance than PP fibers by reducing the possibility of ignition and weakening the flames; higher concentrations of Si source in feeding substrate further improved the fire resistance of fungal fibers.
Upward flame spread test
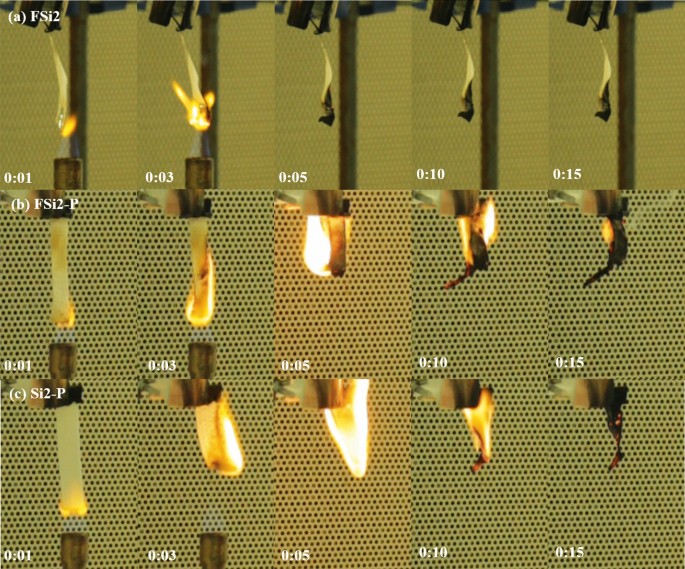
The upward flame spread test modified from the UL-94 V test was applied to characterize the flame spread rate of fungal materials grown with various Si source. A thin film grown by fungal fibers (FSi0, FSi1, and FSi2) were prepared as thin bar samples with a thickness of 0.25 mm. Fungi-PP fabrics (FSi0-P, FSi1-P, and FSi2-P) were also prepared as bar samples with a thickness of 0.65–0.70 mm. Additionally, PP fabrics (Si0-P, Si1-P, and Si2-P) with a thickness of 0.65–0.70 mm were submerged in the substrate containing different concentrations of Si source for the same incubation period to exclude the influence of Si source on the measurement of flame spread rate. The upward flame spread tests were undertaken using the conditions as described in Sect. “Upward flame spread test”. The observed flame spread phenomena of the contrast samples are shown in Fig. 12.
The Fully Burnt Rate was calculated by the number of samples that were burnt completely divided by the total number of samples. In the FSi (fungi grown in substrate with different Si source concentrations) and FSi-P (fungi-PP fabrics grown with different Si source concentrations) group, not all bar samples were fully burnt; some had residual unburnt material. The Fully Burnt Rates are summarized in Table 5. All samples in the Si-P (PP fabrics submerged in substrate with different Si source concentrations) group were completely burnt, while fungal fibers grown with 1% and 2% Si source were not fully consumed. This indicates that the biological absorption of Si source by fungal metabolism is more effective than the physical absorption of Si source in the Si-P group.
From Fig. 12b, c, it is clear that once FSi2-P and Si2-P were ignited, they burned quickly, and the flame in Si2-P was brighter and stronger than that in FSi2-P. The fungi-PP fabrics grown with 2% Si source were more fire-resistant than PP fabrics submerged in 2% Si source. This indicates that the fungal fibers decreased the intensity of the flame in the PP fabrics. In particular, the fungal fibers grown with 2% Si source were observed to have high fire-resistance. Once the burner was removed, flame in the FSi2 disappeared (Fig. 12a).
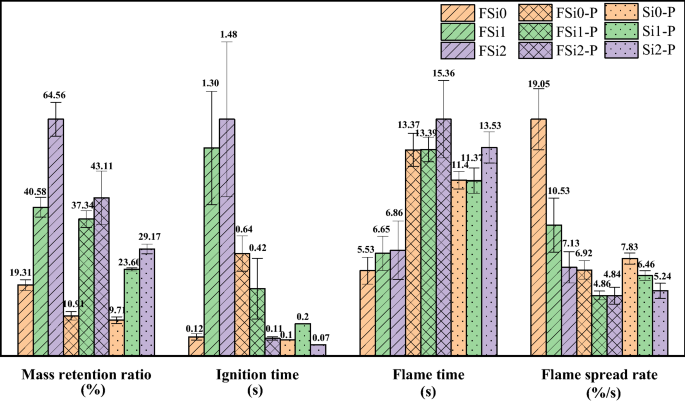
Based on the recorded mass and flame time in the upward flame spread test, mass retention ratio was defined as the final mass divided by the original mass of each sample; flame spread rate was defined as the mass loss ratio divided by total flame time.
Figure 13 shows the results of the upward flame spread test in three groups, i.e., FSi, FSi-P, and Si-P. In the FSi group, with the addition of 1% and 2% Si source in the substrate, 983.33% and 1133.33% longer ignition time, and 20.25% and 24.05% longer flame time were observed in the upward flame spread test; 110.15% and 234.33% more mass was retained in the residual samples after the tests. The flame spread rates of samples decreased by 44.72% and 62.57% in the FSi1 and FSi2. All fungal fibers grown without Si source were completely burnt, however, the Fully Burnt Rates of fungal fibers grown with 1% and 2% Si source were lower (FSi1 was 77.78% and FSi2 was 22.22%).
In the FSi-P group, mass ratios retained in FSi1-P and FSi2-P were 242.56% and 295.14% higher than that retained in FSi0-P. The flame time was increased up to 14.88% in FSi2-P, compared with FSi0-P. The flame spread rate was also decreased by 29.77% and 30.06% for fungi fibers grown with 1% and 2% Si source. All fungi-PP fabrics grown with 0% and 1% Si source were completely burnt. Partial burning was observed in fungi-PP fabrics grown with 2% Si source with a Fully Burnt Rate of 83.33%.
In the Si-P group, 143.05% and 200.41% higher mass retention ratios were obtained in Si1-P and Si2-P, compared with that in Si0-P. The flame time in Si2-P was 18.68% longer than that in Si0-P. The absorption of 1% and 2% Si source led to the reduction of flame spread by 17.50% and 33.08%. All of the samples in the Si-P group were burnt completely.
Among the three groups, more mass was retained in the samples with increasing Si source concentrations in the feeding substrate. The mass retained after the upward flame spread test increased with the increase of Si source and the mass retention ratio increased by 45.25%, 32.20%, and 19.46% when adding 2% Si source in the FSi, FSi-P, and Si-P group. Comparing the increased mass retention ratio in the FSi and Si-P group, it can be concluded that the higher mass retention ratio in the FSi-P group mainly caused by the grown fungi fibers rather than the addition of Si source. The larger mass retained in the residual sample (char yield) was a significant indicator of improved fire resistance, which can potentially improve fire safety when used as fiber reinforcement for concrete structures. The ignition time was longer in the samples in the FSi group than the corresponding samples in the Si-P group with the same concentration of Si source, which shows that fungal fibers are much more difficult to ignite than the PP. The flame spread rates in FSi-P and Si-P groups were similar, which shows that fire spread on flammable PP fibers determines how fast the fire will spread on fungi-PP fabrics. Flame spread rates were significantly reduced in the FSi group, and flame spread rates were further reduced with the increase of Si source. The spread of fire was delayed by the increasing of char that impeded the release of combustible vapor and heat transfer. As shown in Fig. 13 and Table 5, the reduction of the Fully Burnt Rates is caused by the increase of residual mass (or char yields). Additionally, as the MCC results show, the combustible heat release was reduced in fungi grown with increasing Si source, which also contributes to the decrease of the Fully Burnt Rate.
Characterization in post-fire conditions
SEM/EDS analysis of char
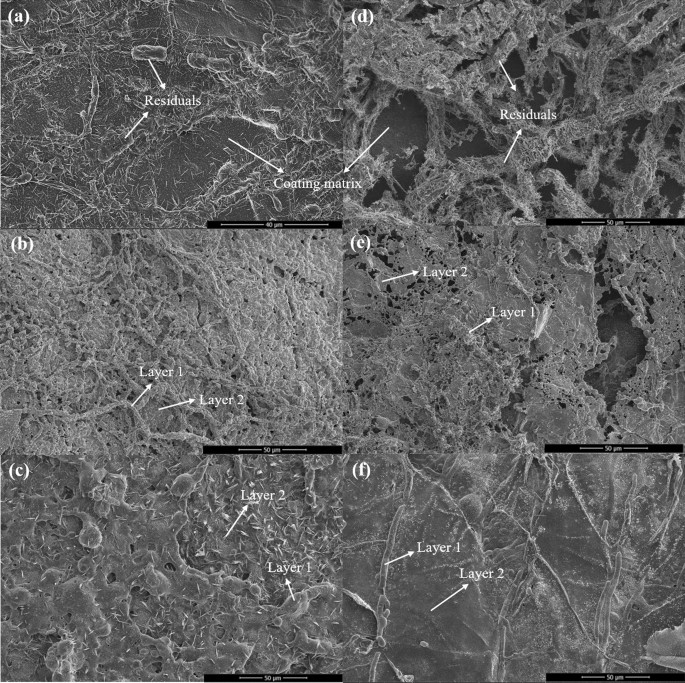
The morphology of char has a significant impact on the fire-resistance. The residual chars were obtained from the burnt samples after the upward flame spread test and their microstructures were characterized by SEM. Figure 14a–c presents the microstructures of the chars obtained from FSi0, FSi1, and FSi2, respectively. Sparse residuals were observed in FSi0 and condensed residuals were retained in samples with higher concentrations of Si source. The microstructure of chars from FSi2 appeared as dense as an intact layer. This condensed char layer blocked both the fuel vapor release and heat transfer to the sample. Similar conclusions were obtained through the analysis of the fungi-PP fabrics grown with Si source after an upward flame spread test (Fig. 14d–f). Figure 14e and f shows that the microstructure of char from FSi1-P and FSi2-P became denser compared with that obtained from FSi0-P. Si source served as a crosslinker in fungal fibers’ structure and contributed to the low thermal conductivity as well as to the delay of vapor generation. This resulted in a dense structure that enhanced the fire protection capability of the residual chars. It is clear that PP fabrics were susceptible to fire because only the fungal fibers and their surroundings were present in the char of FSi0-P. This indicates that fungal fibers have higher resistance to fire than PP fibers. With the increasing Si content in samples, a larger surrounding area could be retained along the fungal fibers. This demonstrate that absorption of Si source further improved the fire resistance of fungal fibers.
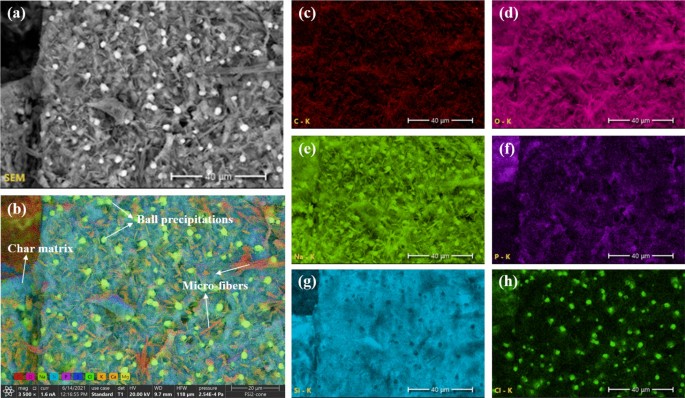
To further understand the chemical composition of char, EDS analysis was conducted on the chars from fungal fibers grown with different concentrations of Si source. Figure 15 shows the main element mappings in char samples obtained from fungal fibers grown with 2% Si source (FSi2) after the heating ignition test. Numerous microfibers and ball precipitations were observed on the surface of the char. The individual element mappings (Fig. 15c–h) demonstrate that the main compositions of the microfibers were carbon and sodium, and the main composition of the ball precipitations was sodium and chlorine. Silicon was not included in the microfibers and ball precipitations. The main fiber structures were destroyed after being exposed to fire, and carbon microfibers were retained. Soluble fungal structure accelerated the evaporation of water contents originally contained in the fungal fiber cell when grown with Si source. The salty composition (sodium and chlorine) and Si source spread from the fungal cells and were found all over the char. The weight ratios of the main elements were summarized in Table 6. With the increase of Si source in the feeding substrate, more Si content was retained after burning. The higher content of Si source slightly enhanced the production of carbon char, which was demonstrated by the carbon contents being 7.9%, 8.7%, and 12.6% in the residuals of samples from FSi0, FSi1, and FSi2, respectively. These traces indicate that Si source that was absorbed in fungal cells improved the char production, which is a significant indicator of stable structure under fire.
FTIR analysis
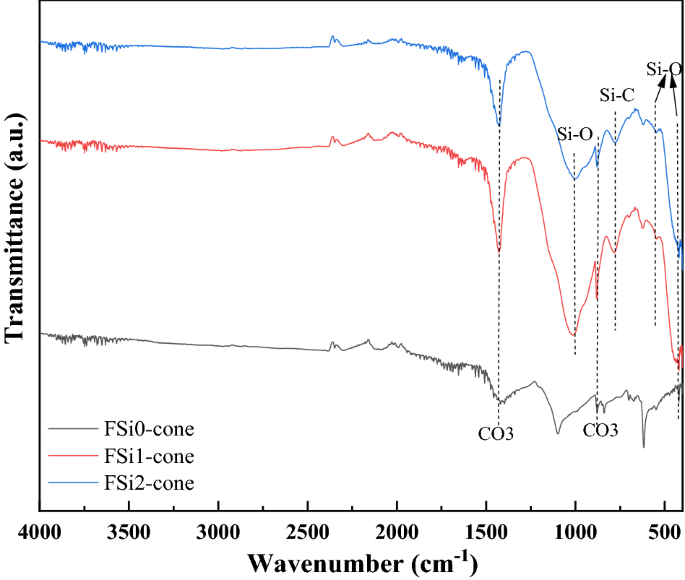
The Fourier transform infrared spectroscopy (FTIR) analysis of residual char samples after the heating ignition test are shown in Fig. 16. The Si–O–C, Si–OH bonds were converted into Si–O bonds during burning33. The Si–O bond was stable and its stretching, bending, and rocking vibration were detected between 1000 and 1100 cm-1, at 460 cm-1, and at 540 cm-1 in the residual char in the fungal fibers grown with Si source23,24. The band at 770 cm-1 corresponded to the presence of Si–C bond in the residual char34. Si–O and Si–C bonds were only detected in the char from the fungal fibers grown with Si source. The sharp band at 879 cm-1 corresponded to the symmetric deformation of the CO3 group35. The broad band at 1430 cm-1 was also attributed to the formation of the CO3 group36. The CO3 group was found in all these samples and was formed by the organic components of fungi exposed to high temperatures. Si–O and Si–C chemical bonds formed in the fungal fibers grown with Si source have higher heat of chemical bond formation (452 kJ·mol−1 and 360 kJ·mol−1) compared with the C–O bond (358 kJ·mol−1) in fungal fibers grown without Si source37. The formation of Si–O and Si–C prevents further pyrolysis and the release of combustible gases, which reduced the heat release rate of fungi grown with Si source19. They contributed to the excellent thermal and fire resistance of fungal fibers38,39.
In summary, fungal fibers grown with Si source are highly thermally stable and fire resistant. The schematic of the mechanism for enhanced fire resistance with Si is shown in Fig. 17. Si source firstly entered fungal cell , leading to the formation of Si–O–C, Si–OH, and Si–O bonds in fungal fibers. When exposing to fire and heat, Si–O–C and Si–OH bonds in fungal fibers were converted into Si–O bond and Si–C bond was also generated in burning fungal fibers. Si–O and Si–C have higher heat of chemical bond formation, contributing to the improved thermal stability. Denser char layer was produced in fungal fibers grown with Si source during fire incident, acting as a barrier to prevent the release of combustible vapor. This would enhance fire resistance of fungal fibers.
[ad_2]
Source link
